- The Mortgage Minute
- Posts
- 🏠 Gen Z vs. Millennials: Who’s Paying More in Rent?
🏠 Gen Z vs. Millennials: Who’s Paying More in Rent?
60 seconds to know...
Aaron Abed
November 22, 2024

The Mortgage Minute newsletter is focused on all things real estate and mortgage-related! Join me on this journey as we explore topics ranging from mortgage strategies and lender partnerships to housing market analyses, regulatory changes and a few Fast and Fun topics. Together, let's elevate our profession and continue to make homeownership dreams a reality for our clients.
30 Year Fixed | 15 Year Fixed | 30 Year FHA |
|---|---|---|
30 Year VA | 30 Year Jumbo | 7/6 SOFR ARM |
Disclaimer: Average mortgage rates as of November 21, 2024. © MND's Daily Rate Index. |
First-time homebuyers:
Get up to $5,250!
There’s no greater feeling than moving into your first home. Getting the keys, opening the front door, making the home your own – all things we want you to experience!
CCM Smart Start will contribute up to $5,250 toward those good feelings. With CCM Smart Start, we’ll cover 2% of the purchase price (up to $5,250) for the down payment so your homeownership dream can come to life.
For terms and conditions👉: https://crosscountrymortgage.com/loan-types/programs/ccm-smart-start/
🏠 Gen Z vs. Millennials: Who’s Paying More in Rent?
I came across an insightful report that compares rent burdens for Gen Z and millennials. I thought you’d find this data interesting, especially as rental demand shifts between these generations.
Here’s a quick breakdown:
Millennials Were Hit Harder: Nearly 60.2% of millennials were “rent burdened” at Gen Z’s current age, spending over 30% of their income on rent.
Gen Z Facing New Challenges: Today, 58.6% of Gen Z renters are in the same boat, with housing costs still at historical highs.
Regional Differences: In cities like Austin, rent burden decreased over the last decade, but in California hotspots like San Diego, the struggle has intensified for Gen Z.
Higher Demand, Lower Inventory: Low housing inventory keeps rental demand and prices high, especially for young adults starting their careers.
Pandemic vs. Housing Crash Impact: The 2008-09 crash hit millennials harder, but Gen Z still faces steep rental costs due to post-pandemic pressures.
Would you like the full report link? Let’s keep our clients informed with the latest data on these shifts in the rental market and help them become homeowners!
All eyes are on buyer agent commissions after the NAR lawsuit settlement – which, so far, have remained unchanged.
Why it matters: The commission settlement changed the mechanics of buyer agency, giving consumers more choice with agents competing on value; the buyer agent commission is a reflection of that value.
This data is from the nation’s largest brokerages and represents about 55,000 closed transactions per month – or about 17 percent of the market.
Dig deeper: There has been no change in average buyer agent commissions since the settlement took effect in August 2024.
Historically, buyer agent commissions fluctuate based on a variety of factors including overall market conditions and seasonality.
For reference, the 0.06% annual decrease in the chart above equates to $245 on a median-priced, $409,000 home.
This data is national and figures will vary by market; the specific number is less important than the vector of change over time.👉Read More

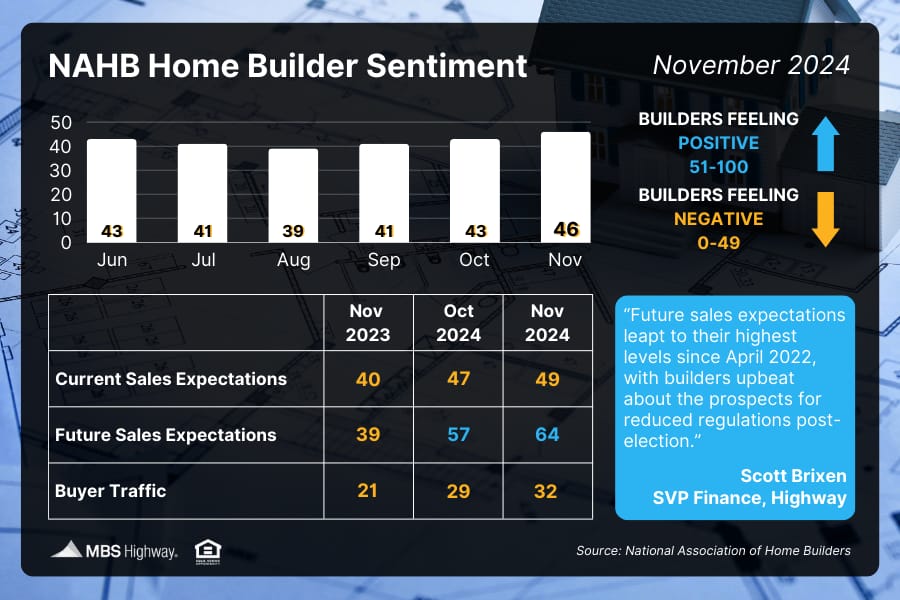
📊 Home Builder Sentiment (November 2024)
Homebuilder confidence rose for the third straight month, up 3 points to 46 in November. All three index components improved, with future sales expectations jumping 7 points to 64, moving well above 50 into expansion territory. #homebuilder #newconstruction
🧘🏼♂️Calmer Trend Continues For Mortgage Rates
By: Matthew Graham
Thu, Nov 21 2024, 4:26 PM
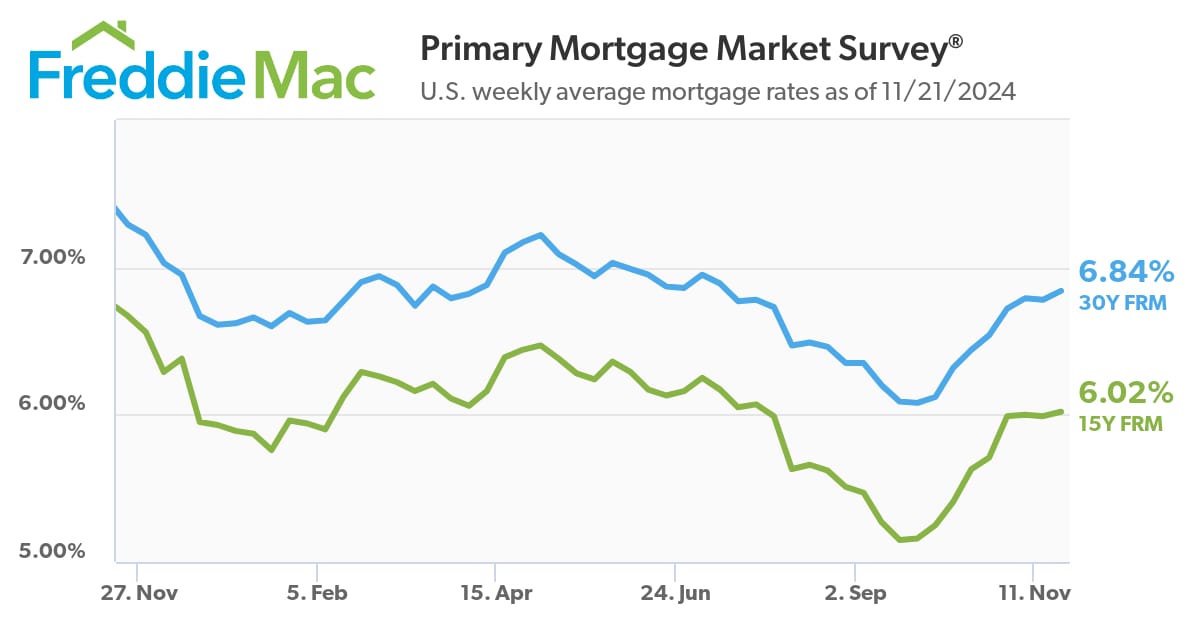
They may not be low. In fact, they may still be a lot higher than you want, but at least they haven't been too volatility this week. For the 7th day in a row, the top tier, conventional 30yr fixed mortgage rate ended the day in the same narrow range between 7.01% and 7.08% for the average lender.
Today's installment was one of the least eventful, with a modest drop from 7.05 to 7.04. The relatively light day over day volatility in mortgage rates is a reflection of the same level of volatility in the underlying bond market. Sure, there have been some fairly big intraday swings at times, but the bigger picture has been much flatter in November compared to October.
The lower volatility in the bond market is fairly easy to reconcile with a lack of actionable economic data. Today's data COULD have been actionable, but it was mixed in its implications for growth. If it had been much stronger or weaker than expected, rates could certainly have moved more meaningfully.
As it stands, the bond market and the mortgage rate watcher are both waiting for early December as the next time frame with truly massive risks of volatility. Please note: this doesn't mean we can't see volatility between now and then! Rather, the early December economic data simply carries the bigger risks of inspiring bigger rate movements. As always, that requires a "for better or worse" qualifier, because volatility can go both ways. It just hasn't gone our way very much since mid September.
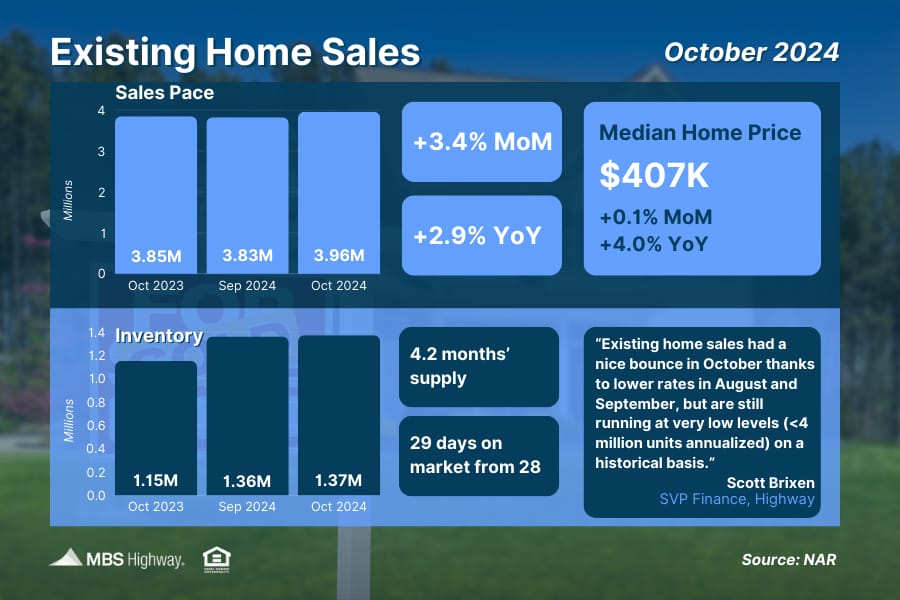
📊 Existing Home Sales (October 2024)
Closings on existing homes were stronger than expected in October, rising 3.4% from September and 2.9% from a year earlier, marking the first annual increase in over three years. Inventory also edged higher (up 0.7% MoM and 19.1% YoY).uction overall. Building Permits, a sign of future construction, also moved lower.
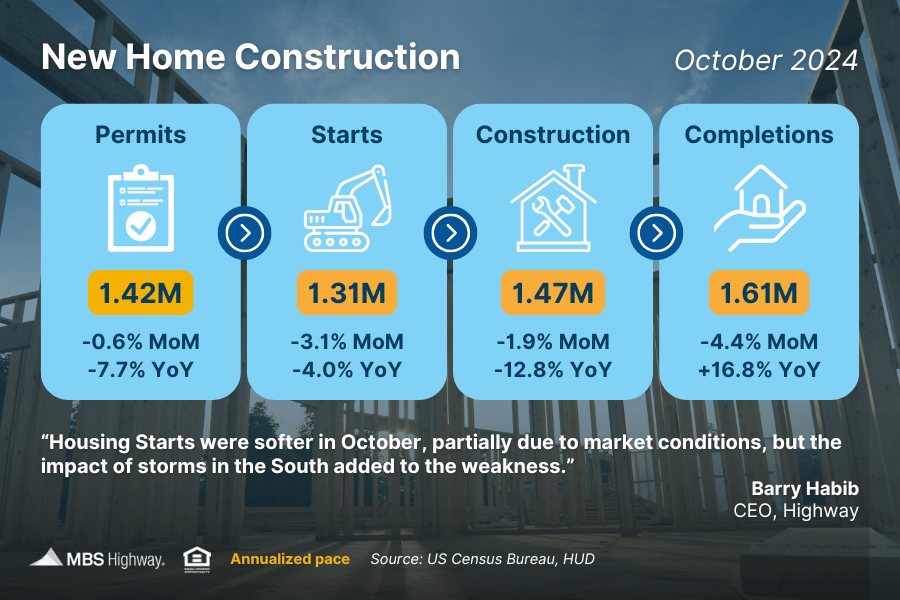
👷🏼 New Home Construction (October 2024)
New home construction slumped in October, with Housing Starts coming in below estimates as hurricanes in the South exacerbated the pullback in construction overall. Building Permits, a sign of future construction, also moved lower.
Existing-home sales climbed 3.4% in October to a seasonally adjusted annual rate of 3.96 million. Sales advanced 2.9% from one year ago, the first year-over-year increase in more than three years (July 2021; +1.8%).
The median existing-home sales price ascended 4.0% from October 2023 to $407,200, the 16th consecutive month of year-over-year price gains.
The inventory of unsold existing homes edged higher by 0.7% from the prior month to 1.37 million at the end of October, or the equivalent of 4.2 months' supply at the current monthly sales pace.
WASHINGTON (November 21, 2024) – Existing-home sales rose in October, according to the National Association of REALTORS®. Sales improved in all four major U.S. regions. Year-over-year, sales elevated in three regions but were unchanged in the Northeast.
Total existing-home sales1 – completed transactions that include single-family homes, townhomes, condominiums and co-ops – expanded 3.4% from September to a seasonally adjusted annual rate of 3.96 million in October. Year-over-year, sales progressed 2.9% (up from 3.85 million in October 2023).
"The worst of the downturn in home sales could be over, with increasing inventory leading to more transactions,” said NAR Chief Economist Lawrence Yun. "Additional job gains and continued economic growth appear assured, resulting in growing housing demand. However, for most first-time homebuyers, mortgage financing is critically important. While mortgage rates remain elevated, they are expected to stabilize.”
👉Read More
The Fast and Fun

🏠 *This week’s “Not a bad shack” on Zillow See Here
🏡 Christina Hall's Stunning 12 Million Dollar House See Here
“Everyone’s paying a mortgage; either your own or someone else’s”
Agents are you looking for Marketing Tools, Help and Ideas?
Let’s connect and talk about how I help Support Your Business
Ask Me About
CardTapp
ListReports
Total Expert
Bid Over Ask Report
Total Cost Analysis Reports
Google Business Page and Reviews