- The Mortgage Minute
- Posts
- 🌟 Are your clients mortgage-ready without knowing It?
🌟 Are your clients mortgage-ready without knowing It?
60 seconds to know...
Aaron Abed
July 26, 2024

The Mortgage Minute newsletter is focused on all things real estate and mortgage-related! Join me on this journey as we explore topics ranging from mortgage strategies and lender partnerships to housing market analyses, regulatory changes and a few Fast and Fun topics. Together, let's elevate our profession and continue to make homeownership dreams a reality for our clients.
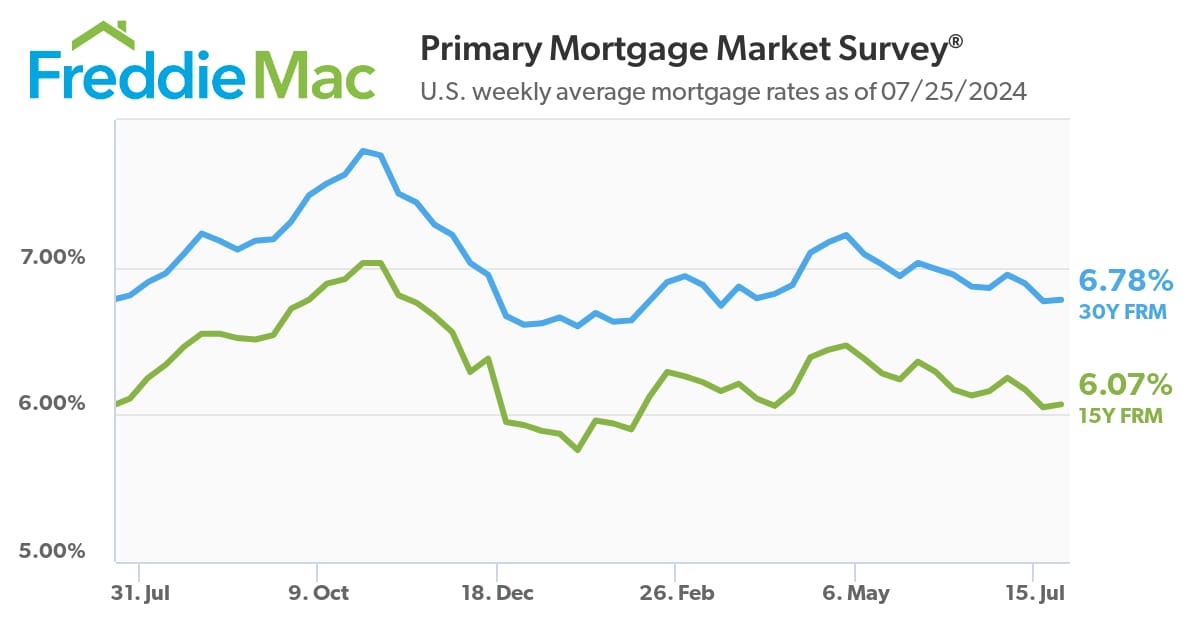
30 Year Fixed | 15 Year Fixed | 30 Year FHA |
|---|---|---|
30 Year VA | 30 Year Jumbo | 7/6 SOFR ARM |
Disclaimer: Average mortgage rates as of July 25 2024. © MND's Daily Rate Index. |
🌟 Are your clients mortgage-ready without knowing It?
I found a great article that might interest you: "Some renters may be ‘mortgage-ready’ and not know it. Here’s how to tell." This piece could be very insightful for our clients who are currently renting but might be in a good position to purchase a home.
Here are a few takeaways:
Mortgage-Ready Renters: In 2022, 39% of U.S. families were renters, and 7.9 million of them were income mortgage-ready. This means their income could comfortably cover a mortgage payment, making homeownership a viable option.
No Harm in Checking Credit: Many potential buyers hesitate to check their credit, fearing it will lower their score. However, soft credit checks are now common and have no impact on credit scores.
Debt-to-income Ratio Tips: Understanding and managing the debt-to-income ratio is key to getting mortgage approval. Some loan options allow for higher debt-to-income rations. FHA, VA, etc. This making it easier for more renters to qualify.
Would you like the full article link? It’s a great resource for understanding how many renters could potentially buy.
Key Points:
Real gross domestic product increased at a 2.8% annualized pace in the second quarter, above the 2.1% forecast.
The personal consumption expenditures price index, a key measure for the Fed, rose 2.6% for the quarter, down from the 3.4% move in Q1. Core PCE prices were up 2.9%, down from 3.7%.
However, the report also indicated that the personal savings rate continues to decelerate, at 3.5% for the quarter, compared with 3.8% in Q1.
Initial jobless claims declined by 10,000, while durable goods orders unexpectedly plunged.
Economic activity in the U.S. was considerably stronger than expected during the second quarter, boosted by a strong consumer, government spending and a sizeable inventory build, according to an initial estimate Thursday from the Commerce Department.
Real gross domestic product, a measure of all the goods and services produced during the April-through-June period, increased at a 2.8% annualized pace adjusted for seasonality and inflation. Economists surveyed by Dow Jones had been looking for growth of 2.1% following a 1.4% rise in the first quarter.👉Read More

By: Matthew Graham
Mortgage rates continue moving in very small steps from day to day--something that's been the case since the Consumer Price Index (CPI) more than 2 weeks ago. Unfortunately, more of those steps have been higher in the past week, and today is no exception for most lenders.
This is counterintuitive to those who closely follow bonds markets and who understand that mortgage rate movement closely matches those underlying market movements. Reason being: bonds are technically in stronger territory compared to yesterday.
Strength in the bond market almost always coincides with lower mortgage rates, but the timing of that strength can cause some inconsistencies. For instance, bonds swooned yesterday afternoon and not every mortgage lender saw fit to raise rates in the middle of the business day in response. Those lenders consequently had to adjust for both yesterday's weakness and today's strength in their latest rate offerings.
Lenders who issued late day reprices yesterday were able to hold steady this morning or even offer slightly lower rates today.
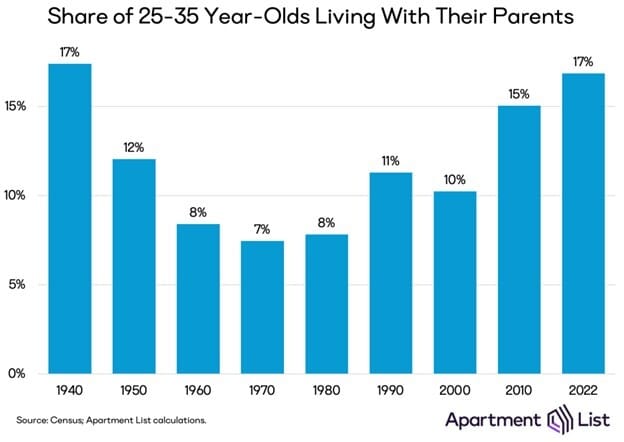
Moving out of one’s parents' house is often thought of as a key milestone on the path to adulthood. But in the face of waning housing affordability, a growing number of Americans are continuing to live with their parents into adulthood. In 1970, just 7 percent of 25 to 35 year-olds lived in their parents’ homes, but as of 2022, that share has more than doubled to 17 percent.
Those young adults who live at home today are also more likely to be there out of necessity rather than choice – fewer than one-in-five are earning incomes that would allow them to comfortably afford local rent prices, a far lower share than in the past. The prevalence of young adults living with parents is increasing in all parts of the country, and for both those with and without college degrees. In this report, we explore the long-term evolution of this trend.👉Read More
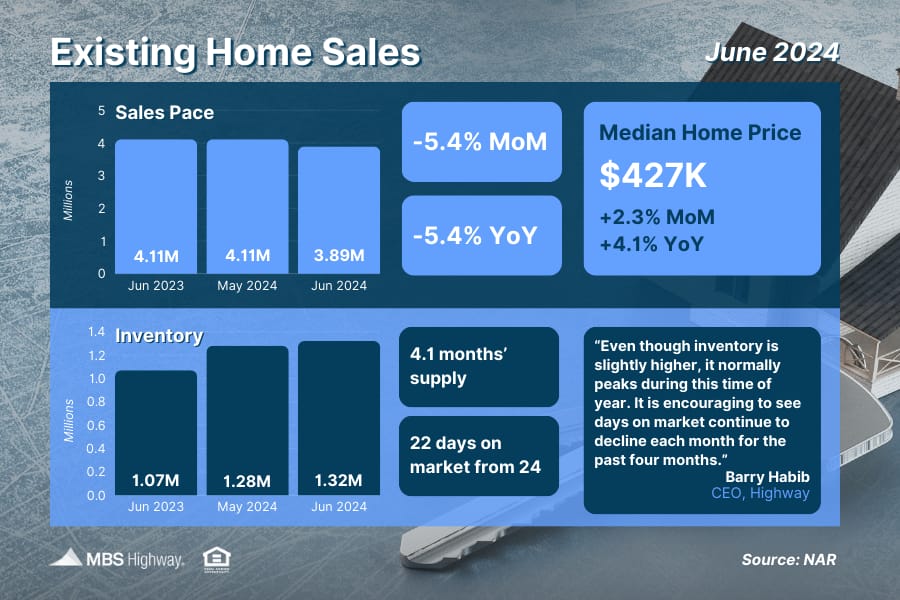
📊 Existing Home Sales (June 2024)
Sales of existing homes fell 5.4% from May to June, marking the fourth straight monthly decline. While total inventory rose to 1.32 million, properties remained on the market an average of 22 days in June, down from 24 days in May, showing that demand remains despite elevated rates.
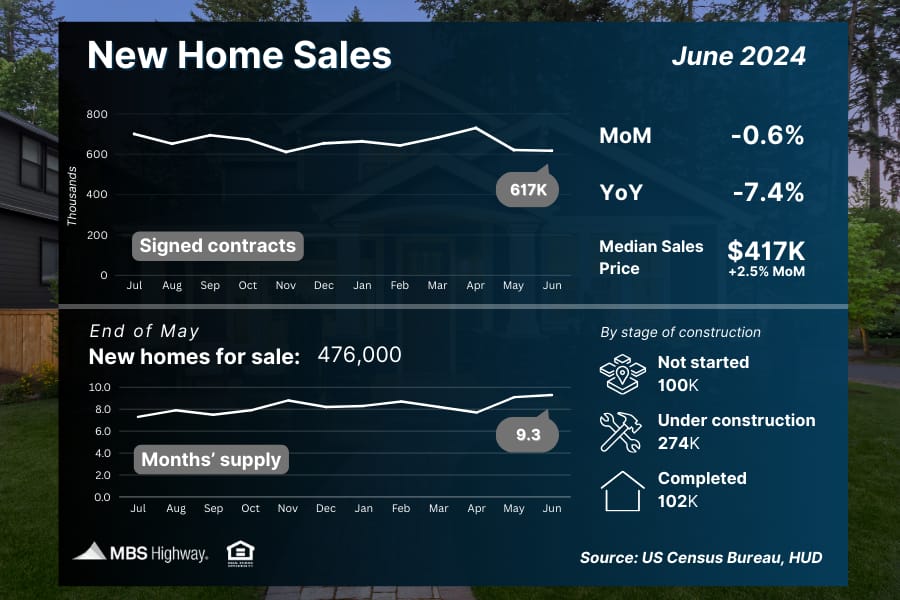
🏘️ New Home Sales (June 2024)
Signed contracts on new homes fell for the second straight month in June, coming in below estimates to reach their lowest level since November. While the supply of new homes on the market has increased, more completed homes are still needed to help meet demand. #homebuyers
🤯 A $1 Million Starter Home is the Norm in 237 Cities
In more than 200 U.S. cities, buyers will find a price tag of $1 million or more on the typical starter home. A housing shortage that worsened over the pandemic has helped drive the cost of all homes to new heights.
The typical “starter home” — defined for this analysis as being among those in the lowest third of home values in a given region — is worth at least $1 million in 237 cities, the most ever. Five years ago, there were only 84 such cities.
Nationwide, the typical starter home is worth $196,611, which is comfortably affordable for a median-income household. However, starter home values have grown 54.1% over the past five years, even more than the 49.1% increase for the typical U.S. home in the same timeframe. That has delayed the first home purchase for many. The median age of a first-time home buyer was 35 last year, a year older than in 2019. 👉 Read More

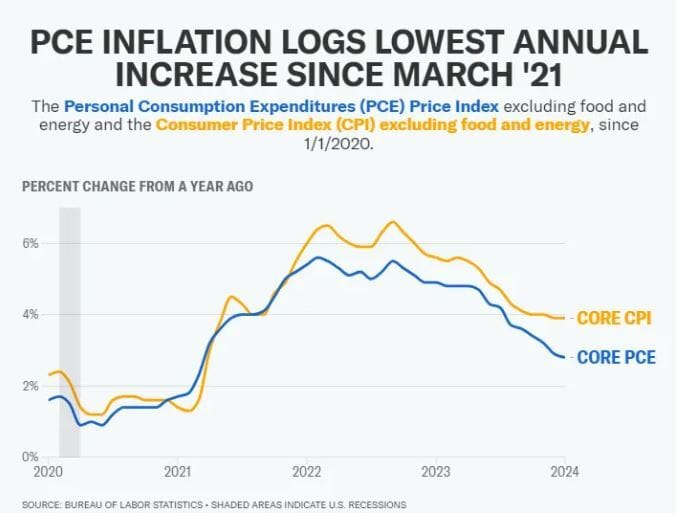
The latest reading of the Fed's preferred inflation gauge showed prices increased slightly more than expected in June.
The core Personal Consumption Expenditures (PCE) index, which strips out the cost of food and energy and is closely watched by the Federal Reserve, rose 2.6% over the prior year in June; above economists' estimate of a 2.5% increase and unchanged from the month prior. Still, the print marked the slowest annual increase for core PCE in more than three years. 👉Read More
The Fast and Fun

🏠 This week’s “Not a bad shack” on Zillow See Here
🏰 Mary J. Blige's ABANDONED Mega Mansion See Here
|

First-time homebuyers:
Get up to $5,250!
There’s no greater feeling than moving into your first home. Getting the keys, opening the front door, making the home your own – all things we want you to experience!
CCM Smart Start will contribute up to $5,250 toward those good feelings. With CCM Smart Start, we’ll cover 2% of the purchase price (up to $5,250) for the down payment so your homeownership dream can come to life.
For terms and conditions👉: https://crosscountrymortgage.com/loan-types/programs/ccm-smart-start/
“Only those who will risk going too far can possibly find out how far one can go.”
Agents are you looking for Marketing Tools, Help and Ideas?
Let’s connect and talk about how I help Support Your Business
Ask Me About
CardTapp
ListReports
Total Expert
Bid Over Ask Report
Total Cost Analysis Reports
Google Business Page and Reviews

Draft